In the ever-changing landscape of financial markets, Technical Analysis offers insightful tools and techniques to make sense of price movements. This analytical framework, embedded in historical data and driven by statistical patterns, presents traders and investors with an objective lens to hone their market decisions. Whether you’re a seasoned market player or a newcomer yearning to understand more about financial markets, this detailed exploration delves into the foundational aspects of Technical Analysis, the role and interpretation of various chart patterns and technical indicators, and the potential limitations and misinterpretations that one must be aware of in this intricate field.
Fundamentals of Technical Analysis
Technical analysis, bolstered by grand swathes of derivation, is an inescapable facet of contemporary finance. This form of forecasting relies heavily on the principle that market prices move in trends and that historical patterns are liable to repetition.
A fundamental pillar of technical analysis is the Doctrine of Price Discounts Everything. This theory posits that everything that can possibly impact a security’s price – from broad economic factors to company-specific aspects – has already been factored into the current market price. Consequently, a close study of price movements, patterns, and trends should provide a comprehensive outlook on the market scenario. This notion underscores the relevance of technical charts, the primary tool used by analysts, transforming datasets into graphical patterns that showcase price and volume over time.
Technical analysts possess immense faith in the self-sustaining and self-repeating nature of market trends. Their belief in the historical repetition principle stems from their understanding of market psychology, particularly the role herd mentality plays in investment decisions. The existence of established trends implies the presence of reliable historical patterns that can alert us to future movements.
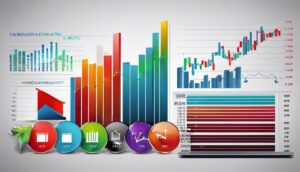
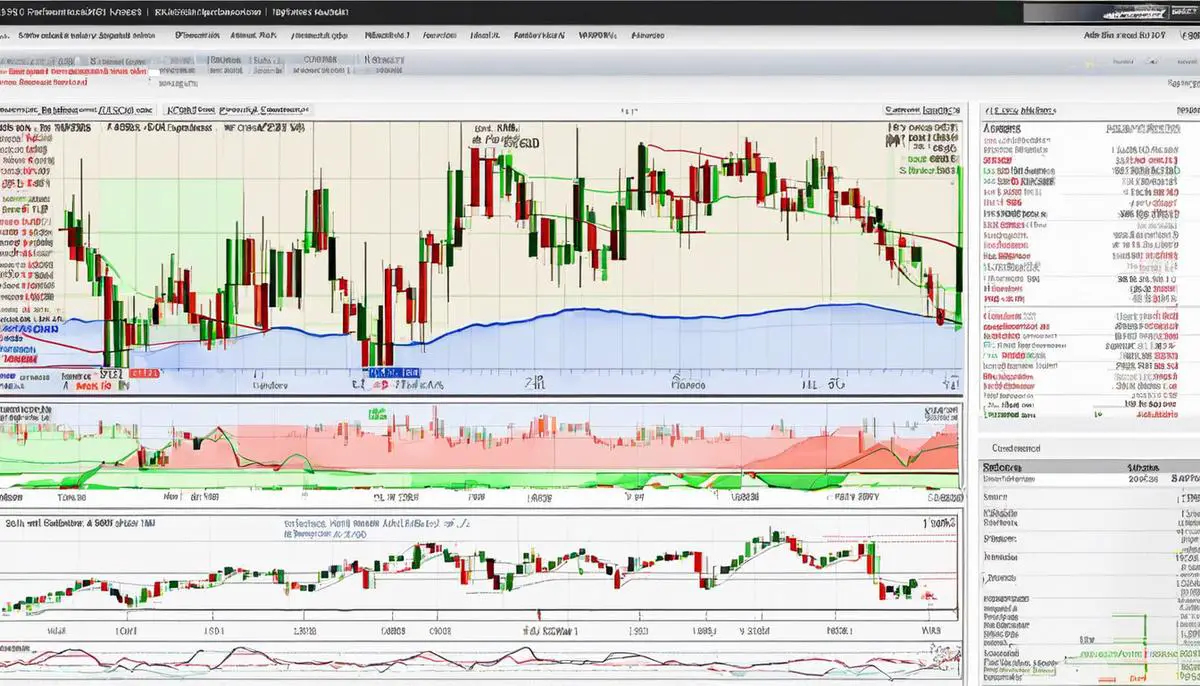
One cannot delve into the techniques of technical analysis without discussing the essential tools in the analyst’s arsenal. Generally, technical analysts employ a wide array of charts and indicators to visualize and predict market patterns. The venerable line, bar, and candlestick charts are mainstays for displaying price data over time. Each charting method excels in its unique way of presenting prices, allowing the analyst to decipher different nuances of market behavior.
On another front, analysists harness trend indicators. Out of the myriad indicators, Moving Average and Bollinger Bands are frequently employed. Moving Averages helps smooth out price data, providing a clearer picture of the underlying trend. In contrast, Bollinger Bands depict the volatility in market prices.
Stochastics and Relative Strength Index (RSI) are examples of momentum indicators that help analysts identify overbought or oversold conditions. Meanwhile, the MACD (Moving Average Convergence Divergence) indicator is a potent tool for pinpointing potential buy and sell signals.
It’s important to remember that while technical analysis provides a systematic approach to interpreting market behavior, it does not provide a crystal ball for future market direction. Even the most seemingly precise model can differ from subsequent reality, as market predictions hinge on probabilities, not certainties.
Ultimately, technical analysis is as much art as it is science. The analyst’s interpretive skill often proves just as (if not more) vital as their technical know-how. An experienced analyst recognizes the fundamental fluidity of market behavior, abstaining from a one-size-fits-all schooling of thought.
The magic, or perhaps the true science of technical analysis, lies in its inherent blending of mathematics, psychology, and instinct. It’s not just about the numbers; it’s also about understanding the complex interplay of market forces from a holistic perspective.
Various Chart Patterns in Technical Analysis
Building upon the foundational knowledge of technical analysis and its intrinsic role in contemporary finance, we delve deeper into the conundrum of deciphering financial market behavior. A paramount component of technical analysis lies in chart patterns. These patterns serve as the pictorial representation of market activity that aid in discerning potential price movement trends based on historical repetition and market psychology.
Consider first the role of primary chart patterns. These include, but are not limited to, head and shoulders, double tops and bottoms, wedges, and triangles. Such patterns appear over an extended period and signal significant market reversals or consolidations. For instance, the ‘Head and Shoulders’ pattern, often observed in bullish markets, typically heralds a bearish trend reversal, while its inverse pattern would indicate the contrary.
Complementing these primary patterns are the secondary chart patterns – flags, pennants, and rectangles. Expressed over shorter periods, they frequently ratify the continuation of a prevailing trend. A ‘Flag’ pattern, for instance, would predict a burst in the same direction as the initial, or primary, trend following a short period of consolidation.
Implementing these chart patterns, technical analysts, or chartists, aim to predict potential price trends in the financial markets, guiding investment decisions. However, they do so with an inherent understanding of the implications of their use. They fathom the probabilistic nature of these patterns and exercise discernment for risk management, acknowledging that chart patterns do not provide absolute certainties.
Patterns, it must be said, are vastly subjective, their recognition quite reliant on the analyst’s acumen and experience. The ability to discern emerging or completed patterns necessitates a judicious approach, blending mathematics, psychology, and instinct. Being a fusion of science and art, the application of chart patterns in technical analysis is a nuanced discipline that extends beyond mere number crunching.
Furthermore, the success of predictive forecasting via chart patterns extends to the integration of other analytical tools such as support and resistance levels, Fibonacci retracements, and volume data. Their amalgamation often enhances the precision of predictive forecasting.
In conclusion, while inherently subjective and probabilistic, chart patterns are invaluable constituents of technical analysis. Their effective application aids in discerning prevalent trends and forecasting potential market turnarounds, thereby augmenting informed investment decisions. They are, unequivocally, more than mere splotches on a chart but are instead the embodiment of dynamic market psychology. As is with all financial analysis tools, they should be employed with judicious wisdom and contextual understanding for efficacious outcomes.

Technical Indicators and their Role
Diving deeper into the proverbial rabbit hole of technical analysis, it is impossible to avoid crossing paths with the significant role of chart patterns. Chart patterns furnish the aficionado of technical analysis with a glimpse into impending price movements, allowing them to anticipate possible market trends.
Primary chart patterns include the likes of the head-and-shoulders, double tops and bottoms, wedges, and triangles. The head-and-shoulders pattern, for instance, is akin to a herald of an impending bearish reversal following an uptrend. To illustrate, the two “shoulders” and one “head”, once identified on a price chart, commingle to forecast a potential downturn in the price.
Yet the artistry of technical analysis doesn’t rest only on primary patterns. Secondary patterns, such as flags, pennants, and rectangles, are equally valuable in their capacity to predict short-term price movements. A ‘flag’, for instance, embodies a breather, a minor pause after a significant price movement, typically an uptrend, hinting at the probable continuation of the trend.
However, these patterns, much like seals contributing to an orchestra, do not play in isolation. They are woven into the larger tapestry of technical analysis by the sagacious application of supplementary analytical tools like support and resistance levels, Fibonacci retracements, and volume data. Understanding the integration of these elements requires an almost Socratic comprehension of the market, fusing the linear thought of a mathematician with the ability to interpret the abstract.
Support and resistance levels, for instance, act like invisible barriers that prevent the price from moving further in a particular direction. These levels hold sway over the identification of chart patterns by helping analysts discern the tipping points that could lead to a future breakout or reversal. Furthermore, Fibonacci retracements serve as a quantifiable measure of how much a stock can move against its original trend, providing invaluable input into forecasting possible pivot points in the market.
The effectiveness of these chart patterns and additional tools is undeniable, given some of the most prominent market turnarounds have been accurately predicted by them. Remember, though, there is a critical caveat. The world of technical analysis is ruled by probabilities, not certainties. It is a realm steeped in the flux of shifting odds.
Hence, the cogent application of these tools demands a degree of decentralization from dogma and an embracing of subjectivity. Being slavishly literal may not serve the technical analyst well, as patterns are rarely ever perfect constructs in the ever-mutating landscape of the market.
Experience and expertise, in this science and art, are priceless. Recognizing patterns in the often chaotic market requires a trained eye and intuition honed over time. As in a detective’s work, patterns start revealing themselves through their subtle footprints in the data, and interpreting them correctly can make the difference between a profitable investment and a less fortunate one.
In sum, the alchemical blend of mathematics, instinct, and psychological astuteness that constitutes technical analysis is exhilaratingly complex. The graceful dance of charts and indicators challenges and rewards the dedicated practitioner in equal measure. It’s a compelling study, etched in the eternal strokes of market heartbeat, where every gleaned insight contributes to the trove of knowledge one amasses on this treasure hunt.
Limitations and Misinterpretations in Technical Analysis
Delving deeper into the labyrinth of rigorous study of technical analysis, we unearth the plateau of the realm often overlooked – the bedrock of common misconceptions, potentially leading to ill-concerted application in various market conditions.
One consistent misinterpretation is the notion of absolute certainty given the presence of a particular chart pattern. Identifying, for instance, a head and shoulders or double top configuration in a chart does not unconditionally imply impending price reversal. At most, it presents a statistical tendency for the price to behave in a certain manner. Consequently, the technical analyst must maintain a clear understanding that while chart patterns provide valuable guidance, they are not infallible predictors of future price action.
Another frequent misconception is the belief in the universal applicability of technical analysis across all market situations. Contrary to this belief, chart patterns’ effectiveness varies, particularly between trending and range-bound markets. Failure to acknowledge this limitation can lead to misguided trading decisions rooted in pattern identification that may not hold relevance in the prevailing market context.
Additionally, the technical world is no stranger to the illusive simplicity trap. The uninitiated are often lured into the convenient simplicity of basic chart patterns such as triangles or flags, mistaking it for ease in mastering the art. However, the effective application of such patterns necessitates a much more profound understanding of market mechanics and the innate ability to weave together multiple analytical strands such as volume data, support and resistance levels, and Fibonacci retracements.
Equally important is the misconception polymerized with an over-reliance on a singular form of analysis. The myriad standalone tools of technical analysis, such as Stochastics or the Relative Strength Indicator (RSI), can offer significant insights. However, their sheer individualistic application in the absence of holistic evaluation often proves detrimental to achieving reliable forecasts.
Finally, the indiscriminate use of the ‘Doctrine of Price Discounts Everything’, underestimates the potential impact of momentous external events such as geopolitical concerns or macroeconomic shifts, which can profoundly disrupt price patterns, thereby derailing even the most meticulously crafted technical analysis.
Encapsulating all the above, it becomes manifest that while technical analysis offers an indispensable lens through which to perceive and anticipate market trends, it must be wielded with due diligence, a healthy dose of skepticism, and an unwavering adaptability to the intricate and evolving dynamics of the financial markets. Indeed, the most effective use of this tool extends beyond mere pattern recognition, steeped in the realms of astute judgment and broader comprehension of the many variables influencing a market’s heartbeat.

Just as a skilled craftsman recognizes the limitations and aptitudes of his tools, a savvy investor or trader should recognize that the practice of Technical Analysis is not without pitfalls. Relying solely on patterns while ignoring market volatility or employing indicators incorrectly can lead to misguided conclusions. Furthermore, a robust trading strategy always pairs perfectly with sound fundamental analysis. The detailed exploration offered above provides a rounded perspective on Technical Analysis, its methodologies, and its caveats, serving as a robust guide in your journey towards becoming a more informed market participant.