Embarking on the world of investing or trading can seem daunting, but understanding the principles of technical analysis can provide valuable insights and tools to navigate the financial markets. This comprehensive guide aims to familiarize you with the core concepts, chart types, trend analysis techniques, and the multitude of indicators used in technical analysis. By developing a strong foundation in these essential topics, you will be well-equipped to design and execute a sound trading strategy tailored to your goals.
Basics of Technical Analysis
Introduction
Technical analysis is a method used by traders and investors to make financial decisions based on predicting future price movements of financial instruments, such as stocks or commodities. In this tutorial, we will cover the core principles of technical analysis and how it differs from fundamental analysis. We will also discuss its practical applications in trading and investing.
1. Core Principles of Technical Analysis
Technical analysis relies on the assumption that all current market information is already reflected in asset prices. Here are the three main principles of technical analysis:
- Price Discounts Everything: This principle suggests that all relevant information is already factored into the price, including economic data, political news, and company-specific events.
- Prices Move in Trends: Technical analysts believe that prices tend to follow trends, either up, down, or sideways. The trend is considered more likely to continue than reverse.
- History Repeats Itself: Price movements follow predictable patterns that are repeated throughout history. These patterns, known as chart patterns, are used to identify trading opportunities.
2. Difference between Technical Analysis and Fundamental Analysis
While technical analysis focuses on historical price movements, patterns, and trends, fundamental analysis evaluates the intrinsic value of an asset by considering financial factors such as revenue, earnings, financial statements, and market conditions.
In short, technical analysis focuses on how the market behaves, while fundamental analysis focuses on why the market behaves a certain way.
3. Key Tools of Technical Analysis
Some commonly used tools include:
- Candlestick Charts: These charts display the opening, closing, high, and low prices for a specific time period, typically a single trading day.
- Moving Averages: A moving average calculates and displays the average price of an asset over a specified period, smoothing out price fluctuations and revealing trends.
- Support and Resistance Levels: Support and resistance levels are price barriers at which an asset’s price typically stops moving and changes direction.
- Technical Indicators: There are various indicators that traders use to assess market conditions, identify potential trade setups, or gauge the strength of trends.
4. Practical Applications of Technical Analysis in Trading and Investing
Technical analysis can be used by both traders and investors to make informed decisions and gauge market sentiment. Here are some practical applications:
- Entry and Exit Points: Technical analysts use chart patterns, support and resistance levels, and technical indicators to identify optimal entry and exit points for trades.
- Risk Management: By analyzing the historical price movements of an asset, traders can determine the potential risk associated with a trade.
- Portfolio Diversification: Technical analysis can also help in effectively diversifying a portfolio by identifying the underlying trends and investing in different asset classes with varying degrees of correlation.
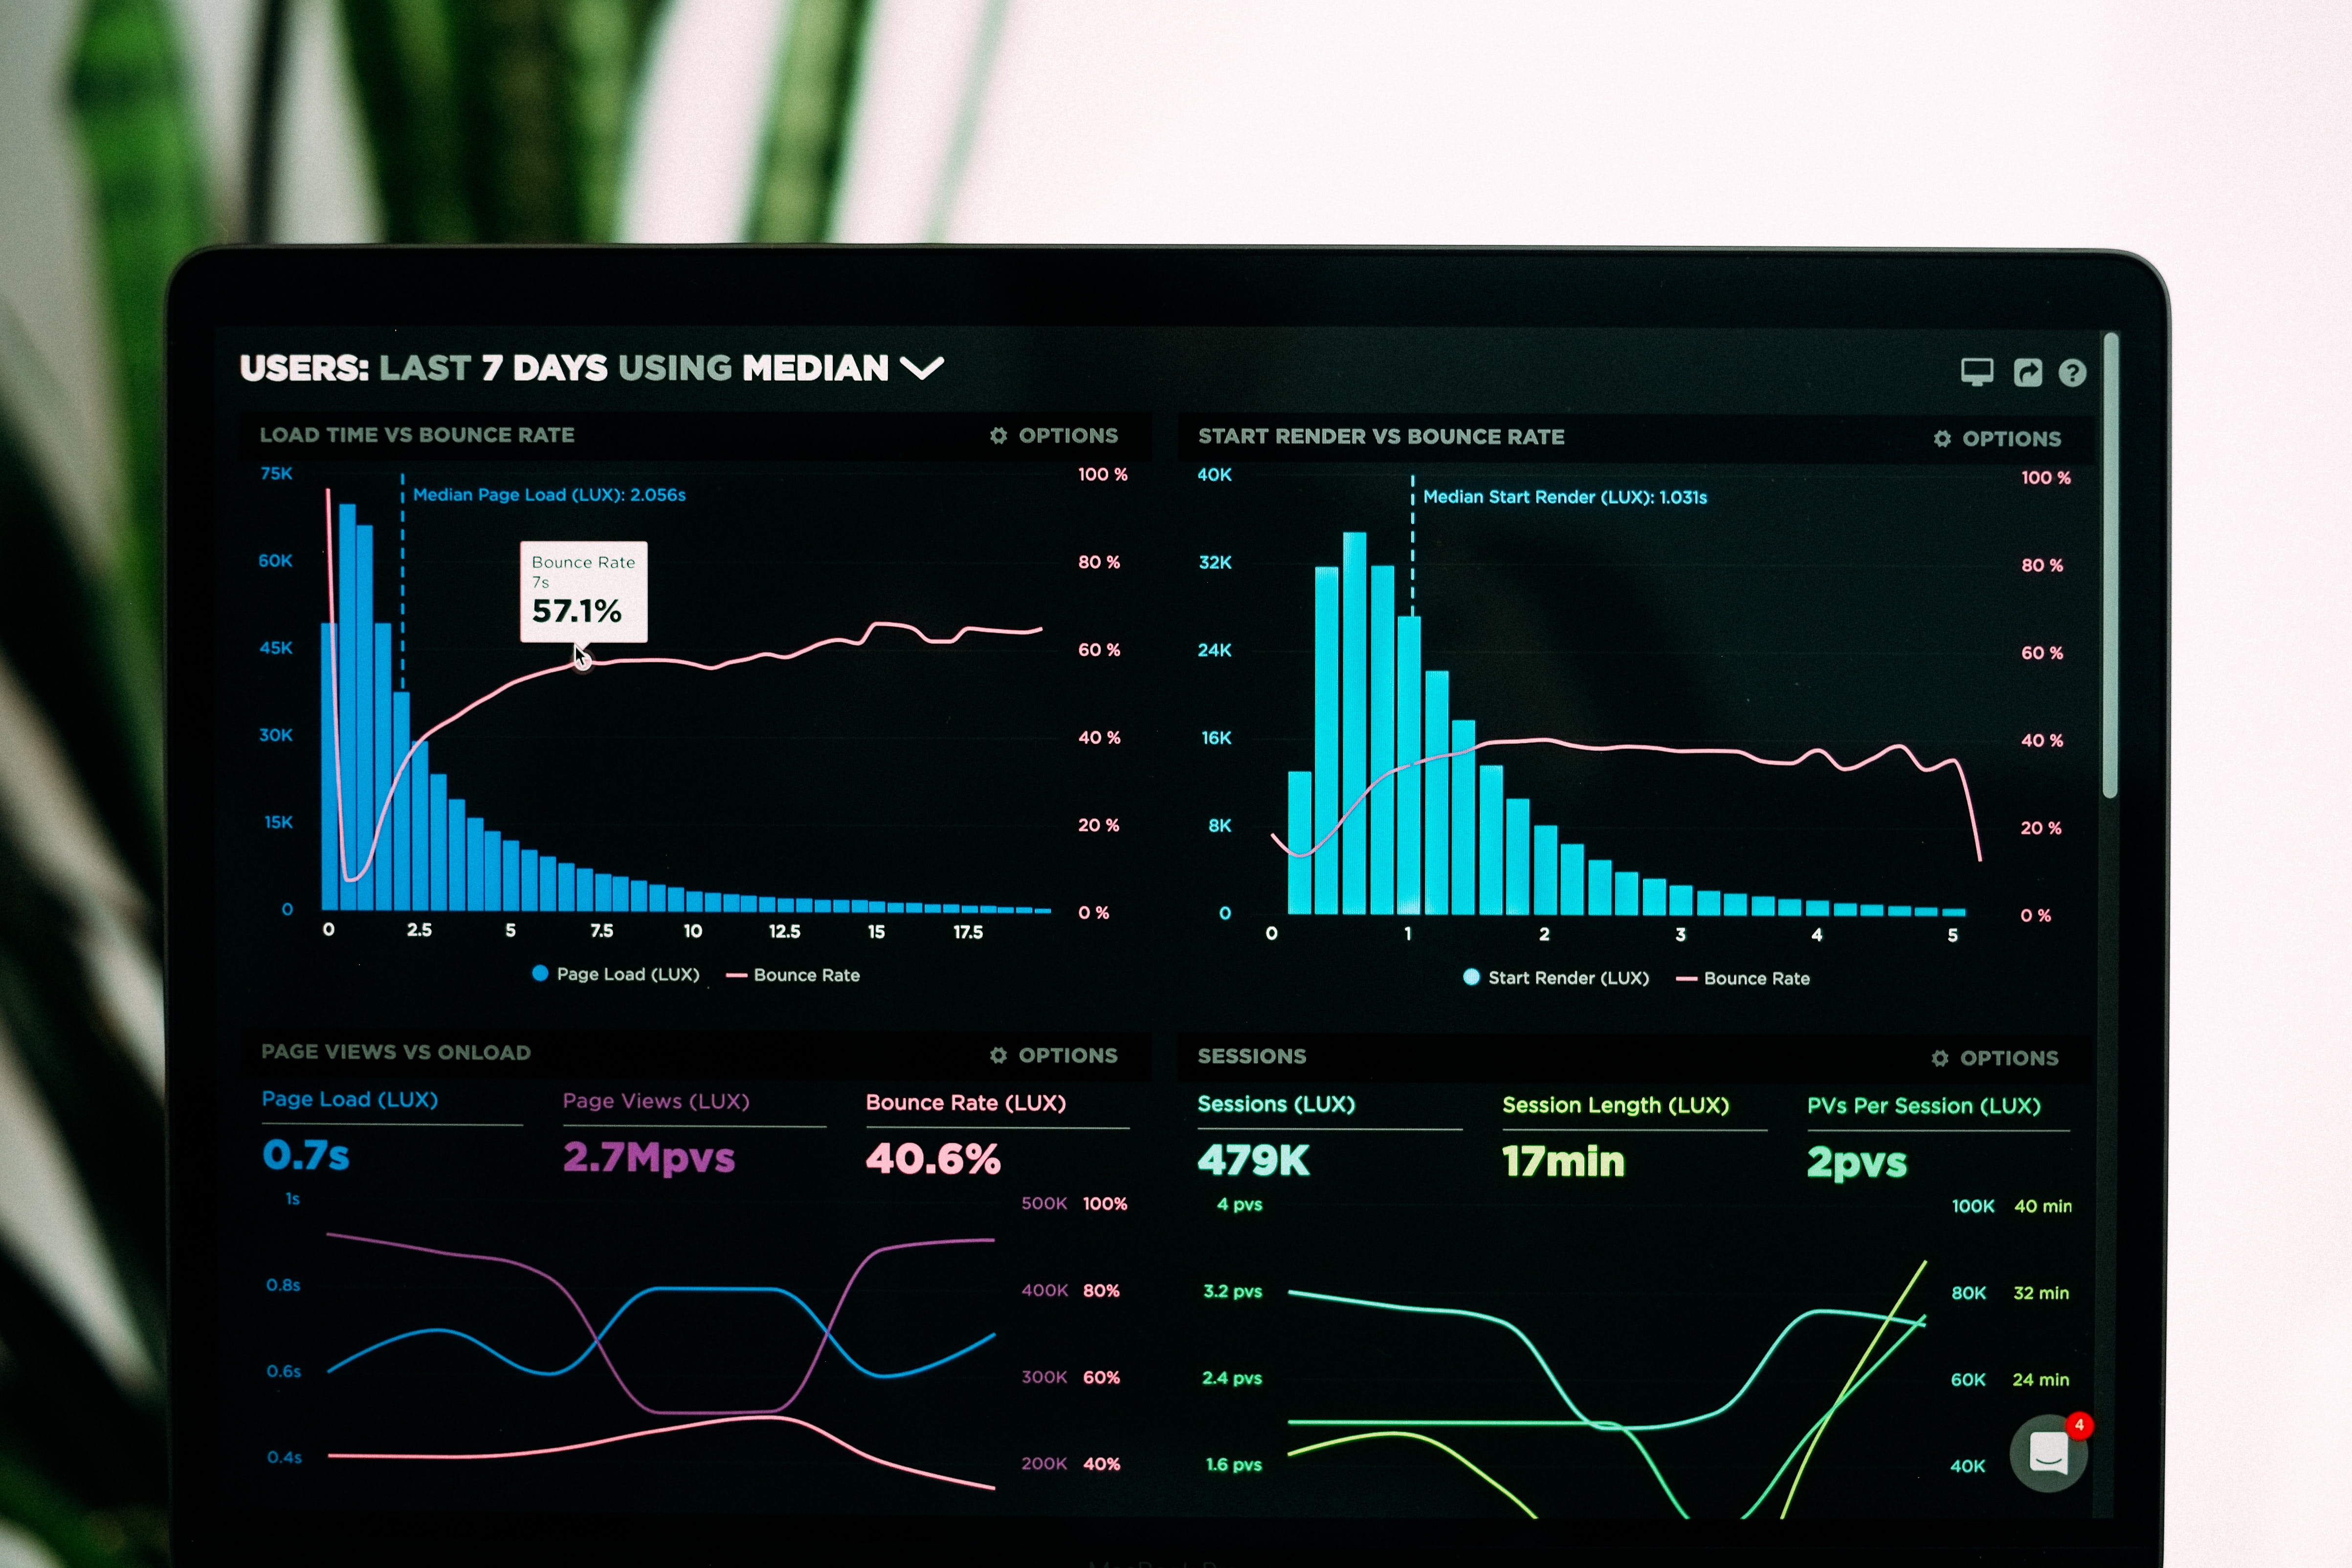
Photo by lukechesser on Unsplash
Chart Types and Timeframes
Intro to Technical Analysis: Chart Types and Timeframes
Technical analysis is a method used by traders to predict the future price movements of financial instruments by analyzing past market data, primarily price and volume. One of the key aspects of technical analysis is the use of charts to visualize these price movements. Various chart types and timeframes are available to traders, allowing them to tailor their analysis to their trading style.
This guide will introduce you to the most common chart types (line, bar, candlestick) and timeframes (intraday, daily, weekly, and monthly) used in technical analysis.
Chart Types:
-
Line Chart:
A line chart is the simplest and most basic type of chart used in technical analysis. It is created by connecting the closing prices of a financial instrument over a specified period with a continuous line.
Pros:
- Easy to read and understand
- Provides a clear overview of the price trend
Cons:
- Doesn’t show the complete price movement (open, high, low, close) during a given period
- Not suitable for detailed analysis
-
Bar Chart:
A bar chart is a more detailed representation of price movements. Each bar represents a specific period (e.g., 1 hour, 1 day) and displays the open, high, low, and close (OHLC) prices for that time span. The chart is created by connecting multiple bars together.
Pros:
- Offers a detailed view of price movements within a given timeframe
- Allows traders to see significant price levels (e.g., support and resistance)
Cons:
- More complex than the line chart
- Can become cluttered and overwhelming with too much data
-
Candlestick Chart:
Candlestick charts are an enhancement of bar charts and provide more visual information. They use similar OHLC data but represent it in a more visually appealing format with “candlesticks.” Each candlestick represents a specified period and displays the open, high, low, and close prices.
Pros:
- Visually appealing and easy to interpret
- Provides useful information on the market sentiment (bullish or bearish) through candlestick patterns
Cons:
- More complex than both line and bar charts
- Learning the various candlestick patterns and their meanings can take time
Timeframes:
-
Intraday:
Intraday timeframes refer to price data within a single trading day, typically in increments of minutes or hours (e.g., 1-minute, 15-minute, 1-hour charts). This type of analysis is most suitable for day traders and scalpers who aim to capture small price movements over a short period.
-
Daily:
Daily timeframes represent the price data for an entire trading day. This type of analysis is useful for swing traders and position traders who look for medium to long-term setups.
-
Weekly:
Weekly timeframes represent the aggregated price data for an entire week. This is ideal for long-term investors and traders who focus on larger price trends and are less concerned with short-term fluctuations.
-
Monthly:
Monthly timeframes represent the aggregated price data for a whole month. These charts are suitable for long-term investors who assess the overall market direction and look for multi-month or multi-year trends.

Trend Analysis
Intro to Technical Analysis: Trend Analysis
Technical analysis is a trading methodology that focuses on the study of historical price patterns and trends to predict future price movements. In this guide, we will introduce you to trend analysis, different types of market trends, and tools for trend identification, including support and resistance levels, trendlines, and moving averages.
1. Types of Market Trends
Market trends can be classified into three categories: uptrend, downtrend, and sideways. Understanding these trends is vital for making informed trading decisions.
- Uptrend: An uptrend is characterized by rising prices and higher highs and higher lows in the price chart. This signals that buyers are in control and demand is surpassing supply. Uptrends indicate a bullish market scenario.
- Downtrend: A downtrend is characterized by falling prices and lower highs and lower lows in the price chart. This signals that sellers are in control and supply is surpassing demand. Downtrends indicate a bearish market scenario.
- Sideways: A sideways trend is characterized by a horizontal price movement, where neither the buyers nor the sellers have the upper hand. This is also known as a consolidation phase or range-bound market.
2. Tools for Trend Identification
There are several tools available for identifying market trends:
- Support and Resistance Levels: Horizontal lines that represent key price levels where buying or selling pressure is expected to be strong. Identifying support and resistance levels can help determine potential entry and exit points in a trade.
- Trendlines: Straight lines that connect higher lows in an uptrend or lower highs in a downtrend and help traders visualize the prevailing trend. A break of the trendline can indicate a potential trend reversal.
- Moving Averages: Used to smooth out price fluctuations and help identify the underlying trend. Traders often use two or more moving averages with different timeframes (i.e., 50-day and 200-day SMA) to generate buy and sell signals.
3. Steps to Perform Trend Analysis
To perform trend analysis, follow these steps:
- Choose a Time Frame: Determine the time frame that suits your trading style and objectives.
- Identify the Trend: Utilize the tools introduced above to determine the prevailing trend.
- Confirm the Trend: Cross-check your analysis using different timeframes and indicators to confirm the trend.
- Determine Entry and Exit Points: Use the prevailing trend to establish potential entry and exit points for your trades.
- Risk Management: Always have a proper risk management strategy in place to protect your trading capital.
Remember that trend analysis is just one aspect of technical analysis and there are many other concepts and tools to learn. Understanding the basics of trend analysis can help you build a solid foundation for your trading journey. Practice and experience will improve your skills in identifying and interpreting market trends for better trading decisions.

Technical Indicators
Introduction to Technical Analysis:
Technical analysis is a method of analyzing financial markets, such as stocks, forex, commodities, and cryptocurrencies, by examining historical price data and chart patterns. It helps traders and investors make informed decisions about buying and selling securities by identifying potential trends and market reversals. Technical analysts believe that all current market information is reflected in a security’s price, making it essential to study price movements and related indicators.
In this introduction, we will learn about some popular technical indicators, including moving averages, relative strength index (RSI), and Bollinger Bands, and provide an overview of their calculations and interpretations.
1. Moving Averages:
A moving average is a widely used technical indicator that calculates the average price of an asset over a specified period. It smooths out price data, making it easier to spot trends and reversals. There are two common types of moving averages: simple moving average (SMA) and exponential moving average (EMA).
Simple Moving Average (SMA):
The SMA is the average price of an asset over a specified period, calculated by adding the closing prices during the period and dividing the result by the number of timeframes.
SMA = (sum of closing prices during the period) / (number of timeframes)
Exponential Moving Average (EMA):
The EMA places more weight on recent data, making it more responsive to price changes.
EMA = (current closing price – previous EMA) * (2 / (number of timeframes + 1)) + previous EMA
2. Relative Strength Index (RSI):
The RSI is a momentum oscillator that measures the speed and change of price movements. It ranges from 0 to 100 and helps identify overbought or oversold conditions in a market.
RSI Calculation:
- Calculate the average gain and average loss over the specified period (usually 14 days).
- Divide the average gain by the average loss to find the relative strength (RS).
- Calculate the RSI using the following formula:
RSI = 100 – (100 / (1 + RS))
An RSI above 70 indicates overbought conditions, while an RSI below 30 signals oversold conditions. These levels can suggest potential reversals or a good time to enter or exit a trade.
3. Bollinger Bands:
Bollinger Bands are a volatility indicator that uses a moving average, typically a 20-day simple moving average, as the centerline. The indicator consists of three lines: the moving average (middle band) and two outer bands calculated by adding and subtracting the standard deviation from the moving average.
Upper Bollinger Band = Moving Average + (Standard Deviation * 2)
Lower Bollinger Band = Moving Average – (Standard Deviation * 2)
Bollinger Bands help traders identify potential breakouts and reversals by showing the relative highs and lows of an asset’s price. When the bands are narrow, it indicates low volatility, while wide bands suggest high volatility. Traders look for price action that crosses the bands or moves close to the bands as potential entry or exit points.
In conclusion, moving averages, relative strength index (RSI), and Bollinger Bands are crucial technical indicators that help traders and investors analyze market trends and make informed decisions. As with any trading strategy, it’s essential to consider a variety of factors, including your risk tolerance and investment objectives, and use multiple indicators and timeframes for a more comprehensive market analysis.

Trading Patterns
Introduction to Technical Analysis
Technical analysis is the study of past market data, such as price and volume, to predict future market trends and possible investment opportunities. It is based on the premise that historical price patterns tend to repeat themselves and helps traders to make informed decisions in trading by identifying those patterns.
In this guide, we will discuss some common trading patterns seen in technical analysis. Here are the steps to familiarize yourself with these trading patterns:
Understand basic price chart concepts:
- Candlestick charts: Familiarize yourself with candlestick charts which represent price movements during a specified period. Each candlestick shows the opening, closing, high, and low prices for that period. Green (or white) candlesticks indicate bullish price action (price going up), while red (or black) candlesticks represent bearish price action (price going down).
- Support and resistance levels: Support levels are price levels at which the demand for an asset is strong enough to prevent the price from falling further. Resistance levels are levels at which selling pressure is strong enough to suppress price gains. Identifying support and resistance levels can help you anticipate potential price movements and set appropriate stop-loss or profit-taking points.
- Trendlines: A trendline is a straight line that connects two or more price points and extends into the future to act as a line of support or resistance. Upward trendlines represent support levels and are drawn below prices, while downward trendlines represent resistance levels and are drawn above prices.
Learn common trading patterns:
- Head and Shoulders: This pattern consists of three consecutive peaks, with the middle peak (head) being the highest and two symmetrically lower peaks (shoulders) on either side. It is a bearish reversal pattern that signals a potential downturn in the market after an uptrend.
- Inverse Head and Shoulders: This is the opposite of the head and shoulders pattern, consisting of three troughs. The middle trough (head) is the deepest, with two symmetrically higher troughs (shoulders) on either side. This bullish reversal pattern signals a potential upward movement in the market after a downtrend.
- Double Tops and Bottoms: Double tops have two consecutive peaks reaching approximately the same price level and can indicate a bearish market reversal. Double bottoms are the opposite, with two consecutive troughs at similar price levels, signaling a potential bullish market reversal.
- Triangles: These patterns result from converging trendlines and can be classified into three types: ascending, descending, and symmetrical.
- Ascending triangles have a flat upper trendline and a rising lower trendline. They are usually seen as bullish continuation patterns.
- Descending triangles have a flat lower trendline and a downward-sloping upper trendline, often regarded as bearish continuation patterns.
- Symmetrical triangles have trendlines that converge with a similar angle, indicating or that there is indecision among buyers and sellers. The breakout direction (above or below the triangle) will determine the ongoing trend (bullish or bearish).
Analyze potential trading opportunities:
Once you have identified a pattern, you can determine potential entry and exit points, stop-loss levels, and profit targets. For example, in a head and shoulders pattern, a trader could short-sell a stock when the price breaks below the neckline (the support line connecting the two lows between the head and shoulders) and place a stop-loss above the right shoulder. The profit target could be calculated by measuring the distance between the head and the neckline and subtracting that from the neckline’s price.
Combine technical analysis tools:
While trading patterns can provide valuable insight, they are often more reliable when combined with other technical analysis tools like moving averages, volume analysis, and technical indicators (e.g., RSI, MACD, etc.). By considering multiple factors, you are more likely to make informed trading decisions.
Practice and refine your skills:
Trading simulator apps and paper trading are excellent ways to practice and hone your skills in technical analysis before committing real money to trades. As you gain experience, you will begin to recognize patterns more quickly and develop your strategies for trading them effectively.
In conclusion, understanding common trading patterns and utilizing them alongside other technical analysis tools can help you develop effective trading strategies and navigate the markets with confidence. Remember to practice, stay disciplined, and continuously refine your skills to achieve success in the world of trading.

Volume and Momentum Analysis
Title: Intro to Technical Analysis: Volume and Momentum Analysis
Introduction:
Technical analysis is a method of evaluating financial assets, such as stocks, by analyzing historical price and volume data. Volume and momentum analysis are two vital components of technical analysis that can help traders and investors gauge the strength of price movements in the financial markets. In this guide, we will discuss the importance of volume and momentum indicators, such as On-Balance Volume (OBV) and Moving Average Convergence/Divergence (MACD), and how to effectively use them in your trading strategy.
Part 1: Understanding Volume Analysis
Volume is a measure of the total number of shares or contracts traded in a security during a given period. In the context of technical analysis, volume is important because it provides an indication of the level of interest and commitment among buyers and sellers.
- Importance of Volume Analysis:
- Volume acts as a confirmation or validation tool for price action: A general rule of thumb in technical analysis is that price action accompanied by high volume is more significant or reliable than price action with low volume.
- Volume can help identify trends: Rising volume during an upward price movement indicates that the trend is strong, while declining volume during a downward price movement suggests that the trend is weak.
- Volume can help detect price reversals or breakouts: A sudden surge in volume after a prolonged period of low volume may signify an impending price reversal or breakthrough.
Part 2: On-Balance Volume (OBV) Indicator
On-Balance Volume (OBV) is a momentum indicator that measures the cumulative buying and selling pressure in a security by adding the volume of up days and subtracting the volume of down days.
- How to Calculate OBV:
- Start with an initial value, typically zero.
- If today’s closing price is higher than yesterday’s closing price, add today’s volume to the OBV.
- If today’s closing price is lower than yesterday’s closing price, subtract today’s volume from the OBV.
- If today’s closing price is equal to yesterday’s closing price, leave the OBV unchanged.
- How to Use OBV Indicator:
- Look for a divergence between the OBV and price action: If the price is making new highs or lows, but the OBV is not, it could imply a potential price reversal.
- Monitor the OBV trend: A rising OBV trend indicates strong buying pressure, while a declining OBV trend signals strong selling pressure. This can help you anticipate price movements.
Part 3: Moving Average Convergence/Divergence (MACD) Indicator
The MACD is a popular momentum indicator that calculates the difference between two exponential moving averages (EMA) and plots this difference (MACD line) against a signal line, which is an EMA of the MACD line.
- How to Calculate MACD:
- Select two time periods for calculating the EMAs, such as 12 and 26 periods.
- Calculate the 12-period EMA and the 26-period EMA.
- Subtract the 26-period EMA from the 12-period EMA to create the MACD line.
- Calculate the 9-period EMA of the MACD line to create the signal line.
- How to Use MACD Indicator:
- Look for crossovers between the MACD line and the signal line: A bullish signal occurs when the MACD line crosses above the signal line, while a bearish signal occurs when the MACD line crosses below the signal line.
- Pay attention to MACD divergence: If the price makes new highs or lows, but the MACD is not, it could suggest a potential price reversal.
Conclusion:
Volume and momentum analysis are essential tools for traders and investors to assess the strength of price movements in the financial markets. By understanding and incorporating the OBV and MACD indicators into your technical analysis strategy, you can make more informed decisions and potentially improve your trading success.

Fibonacci Tools
Title: An Introduction to Fibonacci Tools in Technical Analysis
Objective:
Understand the application of Fibonacci retracements, extensions, and arcs in technical analysis to identify potential support and resistance levels.
Introduction:
Technical analysis is a method of evaluating financial assets by analyzing historical price data and identifying patterns to predict future price movements. One popular technique used in technical analysis is the application of Fibonacci tools, which help traders identify potential support and resistance levels in the market. In this guide, we will provide an introduction to three essential Fibonacci tools: retracements, extensions, and arcs.
Part 1: Fibonacci Retracements
- Understanding the concept: Fibonacci retracements are horizontal lines drawn on a price chart to identify potential reversal points after a significant price movement has occurred. These lines are based on the Fibonacci sequence, where each number is the sum of the two preceding ones (0, 1, 1, 2, 3, 5, 8, 13, 21, and so on).
- Identifying significant price movements: To apply Fibonacci retracements, first identify a significant price movement by locating a clear low and high point on the chart. This movement can be either bullish (upward) or bearish (downward).
- Drawing Fibonacci retracement levels: Once the significant price movement is identified, draw horizontal lines at the key Fibonacci levels to anticipate potential reversal points. Common retracement levels are 23.6%, 38.2%, 50%, 61.8%, and 78.6%.
- Using retracement levels for trading: Fibonacci retracements can be used as potential entry and exit points for trades. Traders often look for confirmation from other technical indicators before acting on these levels.
Part 2: Fibonacci Extensions
- Understanding the concept: Fibonacci extensions are similar to retracements but are used to project potential profit-taking levels after a price has reversed and started a new trend.
- Identifying the reversal: First, locate a clear reversal point on the chart, which can be a significant low or high, depending on whether the new trend is bullish or bearish.
- Drawing Fibonacci extension levels: Once the reversal point is identified, draw horizontal lines at the key Fibonacci extension levels, such as 127.2%, 161.8%, 261.8%, and 423.6%.
- Using extension levels for trading: Fibonacci extensions serve as potential profit-taking targets for traders. As with retracements, traders often wait for confirmation from other technical indicators before acting on these levels.
Part 3: Fibonacci Arcs
- Understanding the concept: Fibonacci arcs are another tool used to identify potential support and resistance zones on a price chart. The arcs are based on both Fibonacci ratios and time and are drawn as curved lines intersecting the chart at specific points.
- Drawing Fibonacci arcs: To draw Fibonacci arcs, first identify a significant price movement, as you would for retracements. Then, draw a trendline connecting the low and high points of the movement. Finally, using a Fibonacci arc tool, create arcs that intersect the trendline at the various Fibonacci levels (23.6%, 38.2%, 50%, 61.8%).
- Using arcs for trading: Fibonacci arcs can be used similarly to retracements and extensions, as potential support and resistance zones. As always, traders should look for confirmation from other technical indicators before acting on these levels.
Conclusion:
Fibonacci tools are valuable resources for traders looking to identify potential support and resistance levels in the market. By understanding and applying Fibonacci retracements, extensions, and arcs, you can improve your technical analysis skills and make more informed trading decisions. Remember, it’s essential to use these tools in conjunction with other technical indicators and to practice on demo accounts before risking real capital in the market.
Risk Management
Introduction:
Technical analysis is an essential skill for traders and investors. It helps in understanding price patterns, trends, and potential future movements of financial markets. To navigate the world of technical analysis and trading, it is crucial to understand the importance of risk management. In this guide, we will focus on risk management topics, such as setting stop losses, position sizing, and diversification, to minimize risk while trading based on technical analysis.
Section 1: Setting Stop Losses
1.1 Definition and Purpose:
A stop loss is an order placed with your broker to sell a security when it reaches a specific price. Its primary purpose is to limit your losses in case the market moves against your position.
1.2 How to Set Stop Losses:
- Identify support and resistance levels
- Determine the stop loss price
- Calculate the risk per trade
- Place your stop loss order
Section 2: Position Sizing
2.1 Definition and Purpose:
Position sizing is the process of determining how many shares or contracts to trade based on your risk tolerance and account size. Proper position sizing helps manage risk by ensuring that losses on individual trades don’t significantly harm your overall account balance.
2.2 How to Calculate Position Size:
- Define your risk tolerance
- Calculate the dollar risk per trade
- Determine the risk per share or contract
- Calculate your position size
Section 3: Diversification
3.1 Definition and Purpose:
Diversification is the process of spreading your investments across multiple assets or sectors to reduce the impact of poor performance in any single asset or sector. It’s an essential risk management technique that helps to minimize losses and create a more stable portfolio.
3.2 Tips for Diversification:
- Spread your investments
- Avoid over-concentration
- Monitor and re-balance
Conclusion:
Risk management is a crucial aspect of trading and technical analysis. By setting stop losses, managing position sizing, and diversifying your portfolio, you can minimize risk and protect your account balance while trading based on technical analysis. As you grow more confident and experienced as a trader, refining and fine-tuning these risk management strategies will be vital for long-term success in the financial markets.

Developing a Trading Strategy
Introduction to Technical Analysis and Developing a Trading Strategy
Technical analysis is a method of analyzing financial markets by studying historical price and volume data to predict future price movements. Developing a trading strategy is a systematic approach to identifying profitable opportunities in the market based on your personal preferences, risk tolerance and trading goals.
In this guide, we will combine the knowledge of technical analysis with practical steps to create a comprehensive trading plan, as well as learn how to backtest and refine your strategy to fit your trading goals.
Step 1: Defining Your Trading Goals
Before you develop a trading strategy, it is essential to have a clear understanding of your trading goals, such as:
- Short-term or long-term investing
- Risk tolerance
- Expected return on investment
- Trading style (e.g., day trading, swing trading, or position trading)
Step 2: Identifying Tradable Assets
Based on your trading goals, identify the assets you want to trade, such as stocks, forex, cryptocurrencies or commodities. Consider factors like market volatility, liquidity, and trading hours when selecting your assets.
Step 3: Selecting Technical Indicators
Technical indicators are mathematical calculations based on price and volume data. They help identify trends, reversals, and price patterns. Some common technical indicators include:
- Moving Averages: Help identify the direction of the trend
- Relative Strength Index (RSI): Measures the strength of price movement in an asset
- Bollinger Bands: Helps identify potential reversal points and periods of market volatility
- MACD: Crossover-based indicator that helps identify trend changes
Choose a combination of technical indicators that complement each other and match your trading style.
Step 4: Developing Entry and Exit Rules
Once you’ve selected technical indicators, develop specific rules for entering and exiting a trade. These rules should be designed to maximize profit while minimizing risk. Examples of entry and exit rules might include:
- Buy when the 50-day moving average crosses above the 200-day moving average
- Sell when the RSI reaches 70 or above, indicating overbought conditions
Step 5: Setting Risk Management Parameters
Risk management is crucial for preserving your capital and ensuring the long-term success of your trading strategy. Set stop-loss and take-profit levels to protect your investments, and determine your position size based on your risk tolerance.
Step 6: Backtesting Your Strategy
Before implementing your trading strategy, it’s essential to backtest it using historical price data. This will help you assess its profitability and the potential risks involved. There are various backtesting tools available online, such as TradingView or MetaTrader.
Step 7: Reviewing and Refining Your Strategy
After backtesting, review your strategy to identify its strengths and weaknesses. You may need to adjust your entry and exit rules, technical indicators, or risk management parameters based on your findings.
Step 8: Implementing Your Strategy
Once you’re satisfied with your trading strategy, start implementing it on a demo account or with small amounts of capital to validate its effectiveness in real-time market conditions. Monitor and adjust your strategy as needed to ensure continued success.
In summary, developing a trading strategy requires a combination of technical analysis knowledge and practical application. By setting clear goals, selecting suitable assets and technical indicators, defining entry and exit rules, and managing risk, you can create a profitable trading plan that meets your individual needs. Remember to constantly backtest, review, and refine your strategy to stay ahead in the ever-changing financial markets.

Photo by lukechesser on Unsplash
As you delve deeper into the fascinating realm of technical analysis, you’ll find that these essentials provide a strong foundation on which to build your skills. Whether you are an aspiring investor or a seasoned trader, refining and expanding your technical knowledge will empower you to make more informed decisions when navigating the financial markets. Ultimately, by combining careful risk management, steadfast discipline, and continual learning, you can enhance your potential for success in the ever-evolving world of trading and investing.